Using Volume and Price Range to Identify High-Volatility Stocks
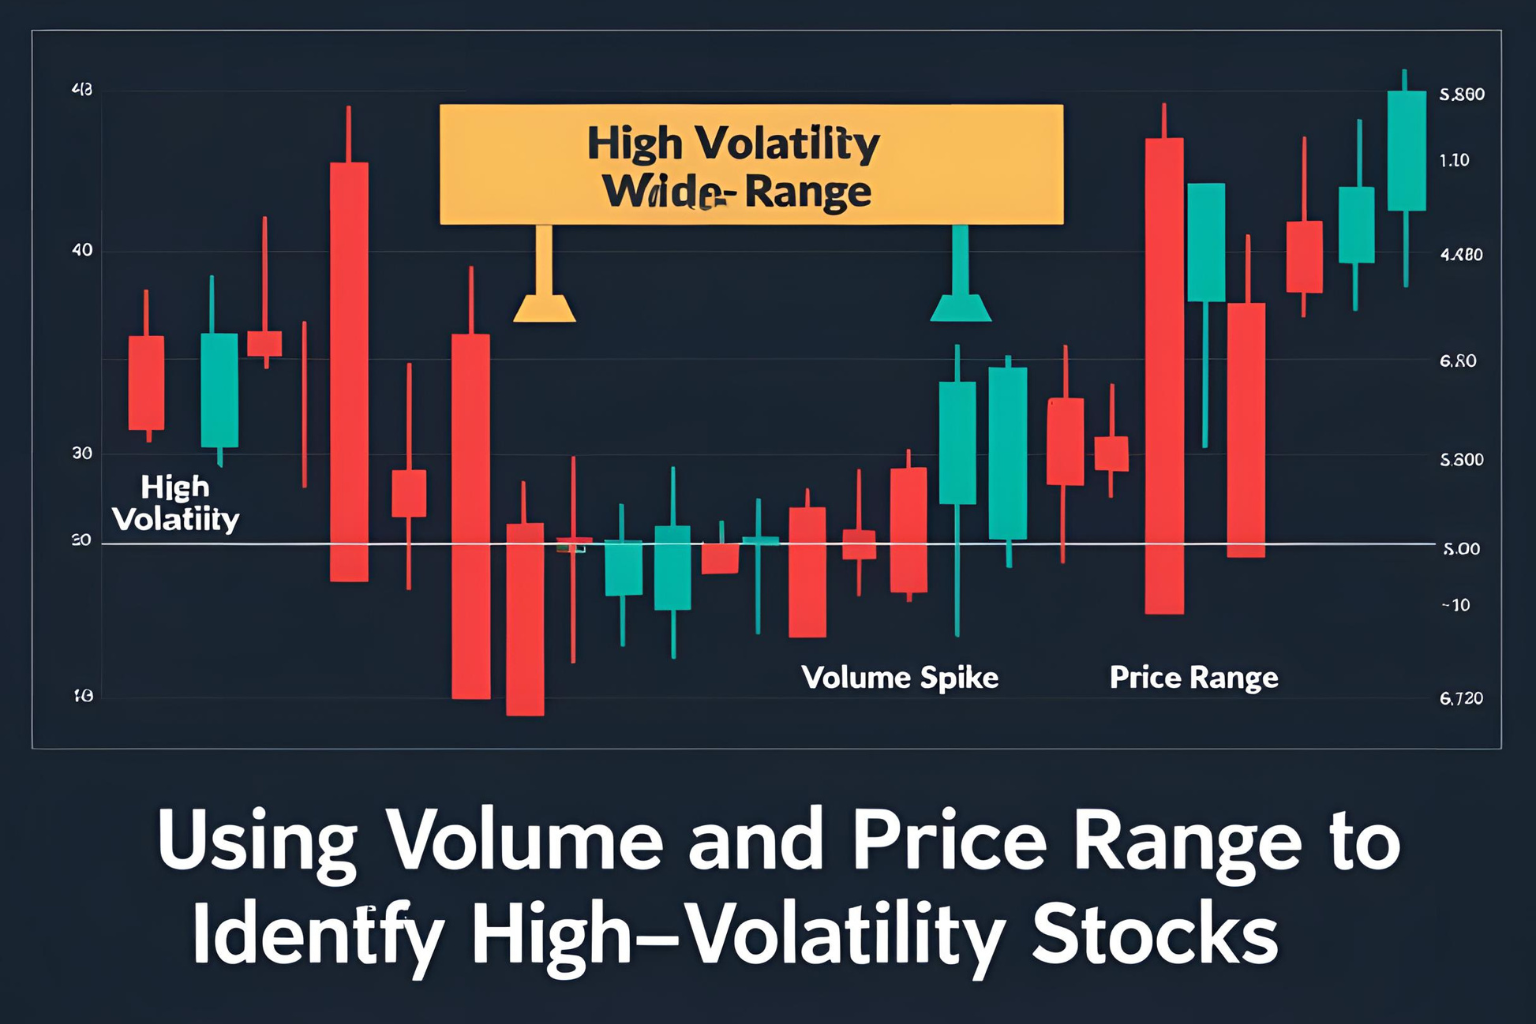
Finding high-volatility stocks is a top priority for active traders, especially those who focus on day trading and swing setups. Two of the most reliable indicators of volatility are volume and price range. When combined, they can help you quickly identify stocks that are making powerful moves and attracting trader interest.
In this guide, we’ll break down how to use volume and price range to filter for high-volatility stocks and make smarter trading decisions.
Why Focus on Volume and Price Range?
Volatility is simply how much a stock moves. But not all movement is meaningful. You want stocks that are:
- Moving significantly in price
- Trading on higher-than-average volume
Together, these two factors show that a stock is experiencing strong interest and potential tradable momentum.
1. How to Use Volume to Spot Volatility
Volume tells you how many shares are being traded. A sudden spike in volume often precedes large price moves.
What to look for:
- Unusual volume: Look for volume 2–3x the stock’s average
- Volume precedes price: Often, price will move after volume builds up
- Volume confirmation: Use volume to confirm breakouts or breakdowns
Tools to use:
- Volume bars on chart platforms (like TradingView or Thinkorswim)
- Volume ratio screeners (e.g., Finviz: “Relative Volume” filter)
2. Measuring Price Range for Volatility
Price range is the difference between a stock’s high and low over a time period—daily, weekly, or intraday.
Metrics to use:
- Average True Range (ATR): Measures recent volatility based on true price range
- Daily Range %: [(High – Low) ÷ Previous Close] × 100
- Gap + Extension: Stocks that gap and continue trending show strong momentum
Example:
- Stock A: Opens at $10, hits high of $10.50, low of $9.80 → 7% intraday range
- This is a strong candidate for active traders
3. How to Combine Volume and Price Range
Use a screener or chart scan to filter:
- Stocks with relative volume > 2
- ATR above 5% of price
- Gap ups/downs with follow-through volume
Trade setup example:
- A stock gaps up 4%, trades 3x its average volume, and breaks previous day high
- Entry on breakout with volume confirmation
- Stop-loss below intraday low or VWAP
- Target based on range projection (1.5–2x risk)
4. Tools and Platforms for Scanning
- Finviz: Use “Average Volume,” “Relative Volume,” and “Price” filters
- TradingView: Create watchlists based on price action + volume spikes
- Benzinga Pro / Market Chameleon: Offer real-time volatility scanners
- StockCharts: Customizable charts with ATR and volume overlays
5. Additional Confirmation Indicators
While volume and range are primary filters, consider adding:
- VWAP: To gauge intraday trend control
- RSI: To spot overbought/oversold extremes on high-volume moves
- Bollinger Bands: For visualizing range expansions
FAQs
What is considered high volume for a stock?
Typically, a volume spike of 2x or more above its 30-day average is significant.
How much range qualifies as high volatility?
Look for stocks with daily ranges of 4% or more, or with ATR values that are 5–10% of the stock price.
Is high volume always a sign of volatility?
No. High volume in a tight range can indicate consolidation. Look for both volume and wide price range together.
Can penny stocks show high volume and range?
Yes, but they carry higher risk. Always apply stricter risk management when trading low-priced stocks.
How often should I scan for these stocks?
Daily scans are ideal—especially before the market opens and at midday for intraday setups.


