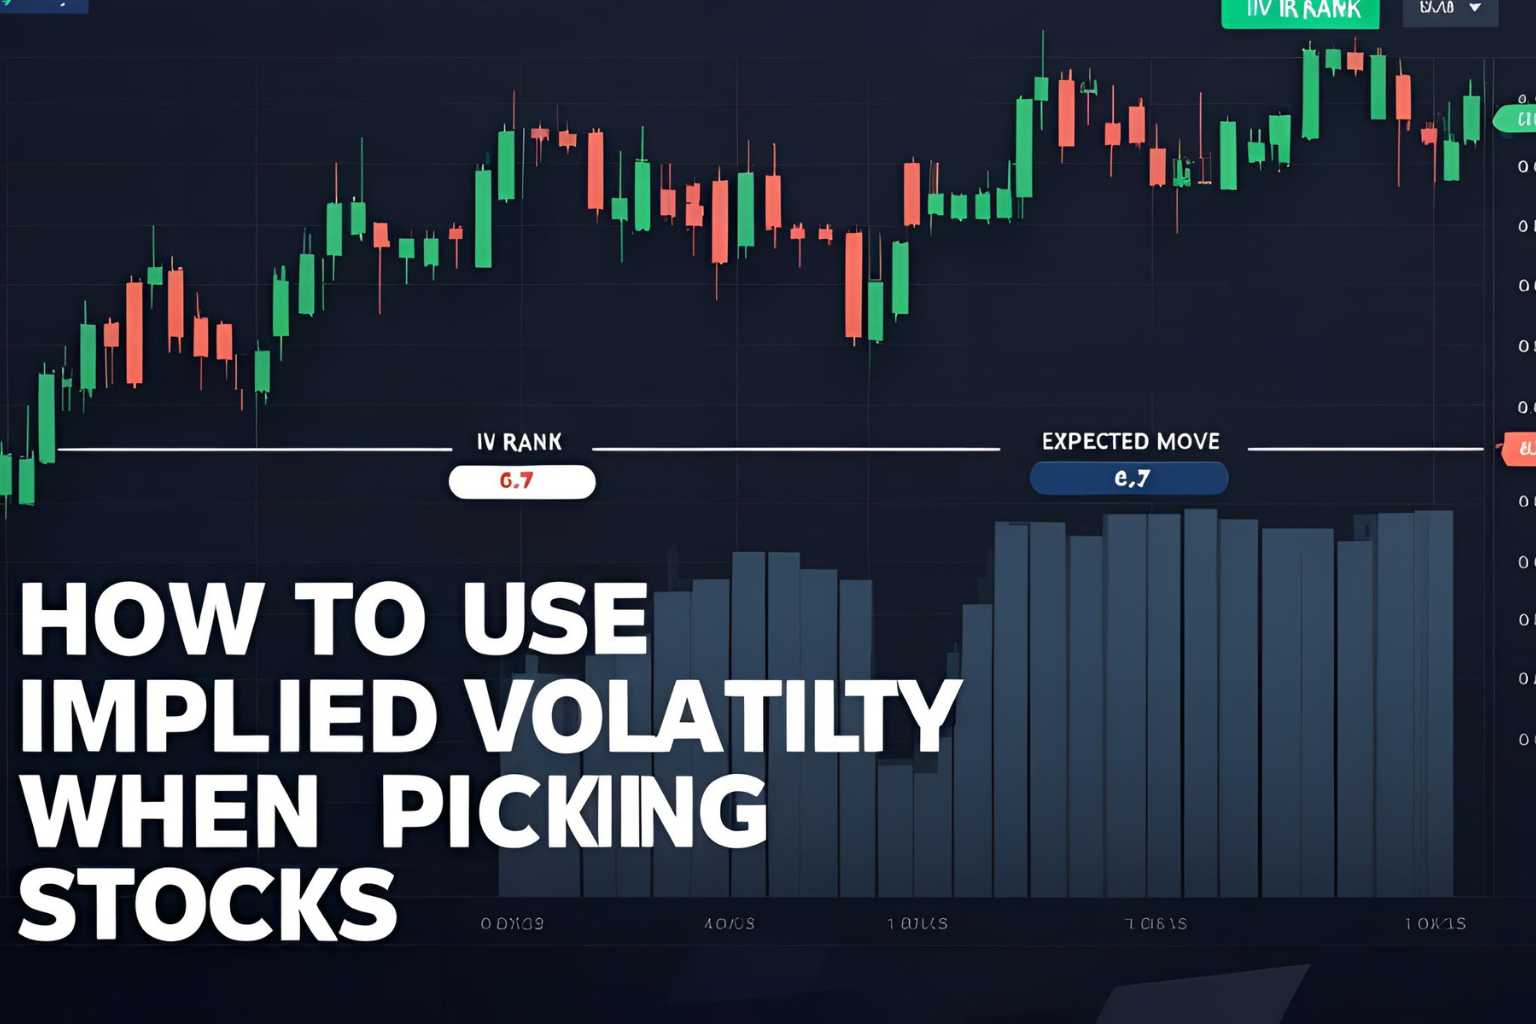
How to Use Implied Volatility When Picking Stocks
Implied volatility (IV) is one of the most important but often misunderstood factors in stock selection—especially for traders involved in options and high-volatility stocks. Whether you’re planning a short-term trade or evaluating a stock for earnings, IV can help you assess market expectations and choose the right strategy.
In this guide, you’ll learn what implied volatility is, why it matters, and how to use it to pick stocks that match your trading goals.
What Is Implied Volatility?
Implied volatility reflects the market’s forecast of a stock’s future volatility—not its past behavior. It’s derived from options pricing models and shows how much the market expects the stock to move over a certain period.
- Expressed as a percentage
- Higher IV = higher expected price swings
- Lower IV = calmer market expectations
For example: If a stock has 50% IV, the market expects a 50% annualized move (up or down).
Why Implied Volatility Matters in Stock Selection
- It reveals market sentiment: Rising IV can signal uncertainty or upcoming catalysts (like earnings or news).
- It affects option pricing: High IV increases option premiums, making them more expensive.
- It helps align your strategy: You can choose stocks based on whether you expect movement or consolidation.
When to Prioritize Implied Volatility
Earnings Plays
- IV typically spikes before earnings announcements
- Look for stocks with rising IV ahead of the report
- You can trade the expected move using options or select stocks with strong history of post-earnings volatility
Event-Driven Setups
- News, product launches, Fed decisions, or geopolitical events often lead to increased IV
- Stocks tied to these events may offer more movement
Momentum Breakouts
- Stocks with IV rising with price may signal strong speculative interest
- Ideal for breakout trades, where volatility expansion supports the move
Tools to Track Implied Volatility
- Thinkorswim (TOS): Built-in IV indicator on charts
- TradingView: Use paid plans or plug-ins to track IV on options-friendly tickers
- Market Chameleon: Offers IV rank, IV percentile, and earnings IV breakdowns
- Benzinga Pro: Monitors IV surges tied to breaking news or analyst sentiment
How to Use IV in Stock Picking
- Scan for stocks with high IV percentile or IV rank
- IV Percentile = How high IV is now relative to the past year
- Example: 90th percentile = Higher than 90% of readings over the past 12 months
- Match IV to strategy
- High IV: Good for options selling (credit spreads, iron condors)
- Low IV: Good for options buying (long calls/puts) before expected breakout
- Check if IV is justified
- Use volume, news, and price action to confirm if rising IV is backed by real momentum
- Avoid trading IV spikes with no fundamental or technical setup
Key Metrics to Watch
| Metric | What It Tells You |
|---|---|
| IV % | Raw implied volatility |
| IV Rank | Where current IV stands relative to 52-week range |
| IV Percentile | How often current IV is exceeded historically |
| Option Volume | Confirms if traders are positioning for moves |
| Historical Volatility (HV) | Past price movement comparison |
FAQs
Is high implied volatility good or bad?
It depends. High IV means higher potential movement—but also more expensive options. It’s good if you expect big moves and bad if you’re overpaying for options.
Can IV predict direction?
No. IV reflects expected magnitude, not direction. Use charts or sentiment to assess bullish/bearish bias.
How do I find high IV stocks?
Use screeners that offer IV Rank or IV %—available in platforms like Thinkorswim, Market Chameleon, or OptionStrat.
Should I avoid low-IV stocks?
Not necessarily. Low-IV stocks can be great for breakout setups when IV expansion is expected.
What’s a good IV Rank for picking stocks?
Anything over 70% is considered high, and under 30% is considered low—use that to guide your strategy selection.


