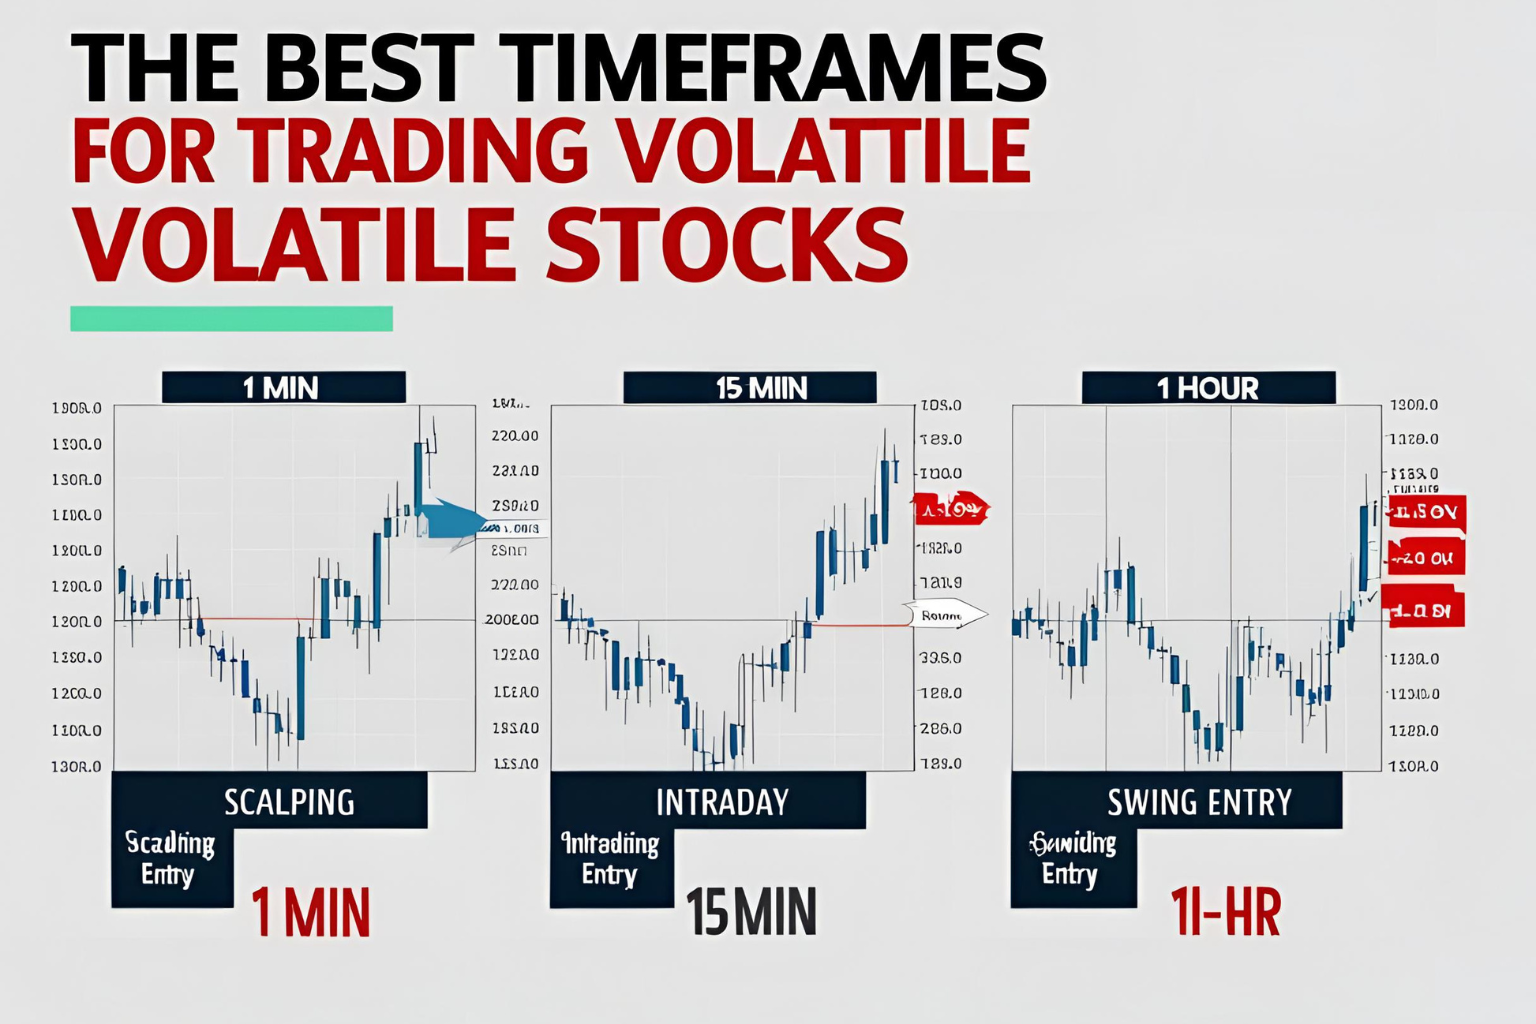
The Best Timeframes for Trading Volatile Stocks
Volatile stocks can make huge price moves in a short time—but choosing the right timeframe is key to capturing those moves without getting shaken out. Whether you’re a scalper, day trader, or swing trader, your timeframe determines how you spot entries, exits, and risk levels.
In this post, we’ll break down the best timeframes for trading volatile stocks, how to use them, and which types of traders each timeframe suits best.
Why Timeframes Matter in Volatile Stock Trading
Volatile stocks can:
- Jump or drop 5–20% within minutes or hours
- Fake out traders on small timeframes with noise
- Show trend clarity only on higher frames
The wrong timeframe can lead to:
- Overtrading
- Missed opportunities
- Misreading price structure
Your timeframe should match your strategy, trading style, and risk tolerance.
1. 1-Minute and 3-Minute Charts (For Scalping)
Best for: Fast scalpers looking for quick entries and exits
Use case: Breakout scalping, VWAP bounces, opening range plays
Pros:
- Granular price action
- Catch early momentum moves
- Ideal for 1–3 point targets on high-volatility names
Cons:
- More noise and false signals
- Requires strong discipline and fast execution
Tip: Use in combo with a 15-minute or higher chart for trend context.
2. 5-Minute Chart (For Intraday Trading)
Best for: Intraday traders holding trades for 10–60 minutes
Use case: Trend-following, flag pattern breakouts, pullbacks
Pros:
- Balanced speed and structure
- Shows clear price zones and trend shifts
- Pairs well with volume and VWAP indicators
Cons:
- Can miss very quick entries in fast-moving stocks
Tip: Use 5-min chart for execution, and 15-min for setup confirmation.
3. 15-Minute and 30-Minute Charts (For Momentum and Swing Entries)
Best for: Traders looking for high-quality setups without overtrading
Use case: Breakout setups, pattern confirmations, swing entries
Pros:
- Smooths out short-term noise
- Shows key levels clearly
- Useful for setting wider stops and targets
Cons:
- Slower signals; less suited for scalping
Tip: Combine with hourly chart for trend confirmation, and set stop-loss based on ATR.
4. 1-Hour Chart (For Swing Trading and Trend Confirmation)
Best for: Swing traders holding 1–5 day trades
Use case: Trend identification, pattern confirmation, position sizing
Pros:
- Captures broader context of market moves
- Reduces false signals
- Works well for volatile stocks with clean structure
Cons:
- Entry points require patience
- Not suitable for very short-term trades
Tip: Use in combination with the 15-min chart for fine-tuning entries.
5. Daily Chart (For Position and Swing Traders)
Best for: Traders and investors managing swing or multi-week trades
Use case: Larger breakout zones, earnings momentum, volatility cycles
Pros:
- Clean long-term patterns
- Strong for spotting breakouts or base formations
- Helps avoid noise
Cons:
- Less reactive to intraday events
- Doesn’t show sharp reversals quickly
Tip: Use the daily chart for macro trend, then drop to the 1H or 15-min chart for entry.
Quick Reference Table
| Timeframe | Best For | Trade Duration | Example Strategy |
|---|---|---|---|
| 1-Min / 3-Min | Scalping | Seconds to minutes | VWAP bounces, breakout pops |
| 5-Min | Intraday trading | Minutes to 1 hour | Trend-following pullbacks |
| 15 / 30-Min | Setup clarity | 1–2 hours | Flag breakouts, ORB setups |
| 1-Hour | Swing trading | 1–5 days | Swing entries, structure view |
| Daily | Position trades | Multi-day to weeks | Breakout, post-earnings moves |
FAQs
What’s the best timeframe for new traders in volatile stocks?
Start with the 5-minute and 15-minute charts. They balance noise and structure well.
Can I use multiple timeframes?
Yes. Use a higher timeframe for trend (e.g., 1-hour) and a lower timeframe (e.g., 5-min) for entries.
Should I use the same timeframe every day?
Stick to one or two primary timeframes that fit your strategy, but check higher frames for confirmation.
Do timeframes work the same for penny stocks?
Yes, but expect more noise and wider spreads. Use higher timeframes for clarity.
What timeframe works best for swing trading high-volatility names?
Use the 1-hour chart for setup and the 15-minute chart to manage entries.


