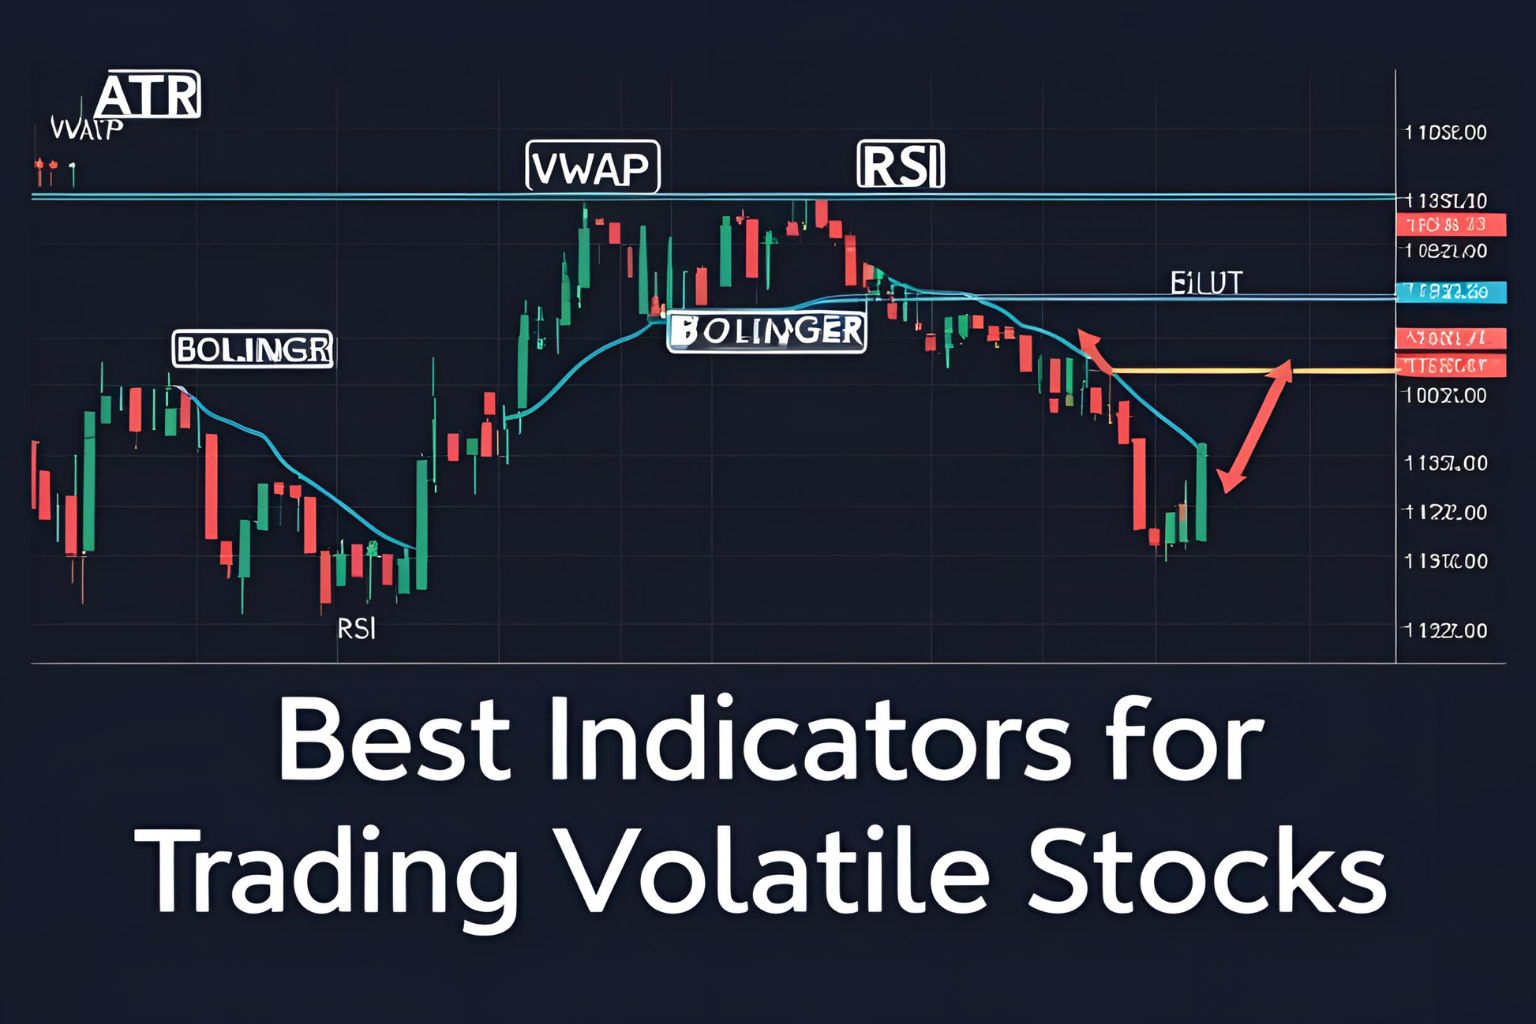
Best Indicators for Trading Volatile Stocks
Volatile stocks offer massive trading potential, but the speed and range of their moves can overwhelm even experienced traders. To trade them successfully, you need tools that help you identify direction, manage entries, and control risk. That’s where technical indicators come in.
In this post, we’ll cover the best indicators for trading volatile stocks, explaining how each works and when to use them.
1. Average True Range (ATR)
Purpose: Measures how much a stock moves on average in a given time period.
Why it matters:
- Helps you gauge volatility levels before entering a trade
- Assists in setting realistic stop-loss and take-profit levels
How to use:
- Add ATR(14) to your chart
- If ATR is rising, volatility is increasing
- Use 1–2× ATR for stop-loss distance in volatile markets
2. VWAP (Volume Weighted Average Price)
Purpose: Shows the average price a stock has traded at throughout the day, weighted by volume.
Why it matters:
- Great for intraday support/resistance
- Institutions use VWAP as a benchmark—price above = bullish bias, below = bearish
How to use:
- Trade pullbacks to VWAP in trending stocks
- Avoid counter-trend trades near VWAP unless confirmed
3. Bollinger Bands
Purpose: Measures price deviation from a moving average using standard deviation.
Why it matters:
- Expanding bands indicate volatility breakouts
- Helps identify overbought/oversold zones
How to use:
- Use the outer bands to anticipate reversals or continuations
- Look for squeeze setups, where tight bands precede a sharp breakout
4. Relative Strength Index (RSI)
Purpose: Measures the speed and change of price movements to detect overbought/oversold conditions.
Why it matters:
- Quickly highlights extreme conditions in volatile stocks
- Useful for entry confirmation on pullbacks or breakout continuations
How to use:
- RSI > 70 = overbought; RSI < 30 = oversold
- In volatile stocks, wait for RSI to pull back to the 50–60 zone before entering long
5. MACD (Moving Average Convergence Divergence)
Purpose: Tracks momentum and trend direction
Why it matters:
- Helps confirm trend continuation or divergence
- Filters out false breakouts in fast-moving stocks
How to use:
- Watch for MACD crossovers above or below zero line
- Use in combination with price action and volume for better signals
Bonus: Volume Analysis
Not an indicator in the traditional sense, but volume is crucial when trading volatile stocks.
Why it matters:
- Confirms breakout strength
- Reveals trader participation in big moves
- Can signal false breakouts when missing
Use it with: VWAP, RSI, Bollinger Bands, and breakout levels
Strategy Tip: Combine Indicators Wisely
Use 2–3 complementary indicators instead of loading your chart with too many. A great combo might be:
- VWAP for trend bias
- RSI for entry timing
- ATR for setting stops
Avoid using multiple momentum indicators that duplicate information.
FAQs
What is the best indicator for volatile intraday stocks?
VWAP paired with ATR and volume is ideal for real-time intraday decision-making.
Can I use these indicators on penny stocks?
Yes, but ensure the stock has enough liquidity. Use tighter settings for faster signals.
Do indicators work during pre-market?
Many indicators lag or lose effectiveness during low-volume sessions. Use caution.
Should I use indicators alone?
No. Combine them with price action, support/resistance zones, and market context.
Are these indicators suitable for swing trading?
Yes. For swing trades, consider adjusting settings (e.g., ATR(21), RSI(14)) and use on 1-hour or daily charts.


